Question 1 Topic 3, Mixed Questions
You have an Azure Synapse workspace named MyWorkspace that contains an Apache Spark database named mytestdb.
You run the following command in an Azure Synapse Analytics Spark pool in MyWorkspace.
CREATE TABLE mytestdb.myParquetTable(
EmployeeID int,
EmployeeName string,
EmployeeStartDate date) USING Parquet
You then use Spark to insert a row into mytestdb.myParquetTable. The row contains the following data.
One minute later, you execute the following query from a serverless SQL pool in MyWorkspace.
SELECT EmployeeID
FROM mytestdb.dbo.myParquetTable WHERE EmployeeName = 'Alice';
What will be returned by the query?
- A. 24
- B. an error
- C. a null value
Answer:
A
Explanation:
Once a database has been created by a Spark job, you can create tables in it with Spark that use Parquet as the storage
format. Table names will be converted to lower case and need to be queried using the lower case name. These tables will
immediately become available for querying by any of the Azure Synapse workspace Spark pools. They can also be used
from any of the Spark jobs subject to permissions.
Note: For external tables, since they are synchronized to serverless SQL pool asynchronously, there will be a delay until they
appear.
Reference: https://docs.microsoft.com/en-us/azure/synapse-analytics/metadata/table
Comments
Question 2 Topic 3, Mixed Questions
DRAG DROP
You have a table named SalesFact in an enterprise data warehouse in Azure Synapse Analytics. SalesFact contains sales
data from the past 36 months and has the following characteristics:
Is partitioned by month
Contains one billion rows
Has clustered columnstore indexes
At the beginning of each month, you need to remove data from SalesFact that is older than 36 months as quickly as
possible.
Which three actions should you perform in sequence in a stored procedure? To answer, move the appropriate actions from
the list of actions to the answer area and arrange them in the correct order.
Select and Place: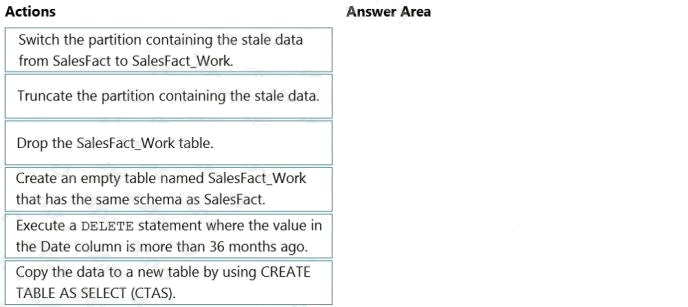
Answer:
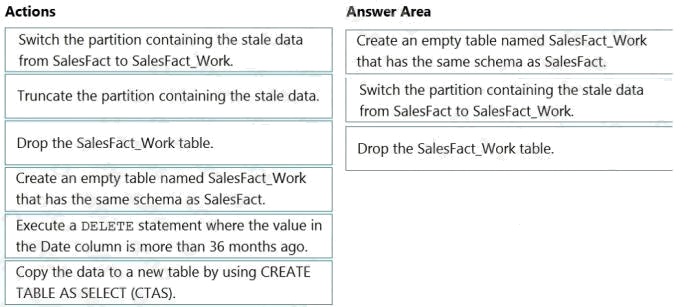
Explanation:
Step 1: Create an empty table named SalesFact_work that has the same schema as SalesFact.
Step 2: Switch the partition containing the stale data from SalesFact to SalesFact_Work.
SQL Data Warehouse supports partition splitting, merging, and switching. To switch partitions between two tables, you must
ensure that the partitions align on their respective boundaries and that the table definitions match.
Loading data into partitions with partition switching is a convenient way stage new data in a table that is not visible to users
the switch in the new data.
Step 3: Drop the SalesFact_Work table.
Reference: https://docs.microsoft.com/en-us/azure/sql-data-warehouse/sql-data-warehouse-tables-partition
Comments
Question 3 Topic 3, Mixed Questions
You have files and folders in Azure Data Lake Storage Gen2 for an Azure Synapse workspace as shown in the following
exhibit.
You create an external table named ExtTable that has LOCATION='/topfolder/'.
When you query ExtTable by using an Azure Synapse Analytics serverless SQL pool, which files are returned?
- A. File2.csv and File3.csv only
- B. File1.csv and File4.csv only
- C. File1.csv, File2.csv, File3.csv, and File4.csv
- D. File1.csv only
Answer:
C
Explanation:
To run a T-SQL query over a set of files within a folder or set of folders while treating them as a single entity or rowset,
provide a path to a folder or a pattern (using wildcards) over a set of files or folders.
Reference: https://docs.microsoft.com/en-us/azure/synapse-analytics/sql/query-data-storage#query-multiple-files-or-folders
Comments
Question 4 Topic 3, Mixed Questions
HOTSPOT
You are planning the deployment of Azure Data Lake Storage Gen2.
You have the following two reports that will access the data lake:
Report1: Reads three columns from a file that contains 50 columns. Report2: Queries a single record based on a

timestamp.
You need to recommend in which format to store the data in the data lake to support the reports. The solution must minimize
read times.
What should you recommend for each report? To answer, select the appropriate options in the answer area.
NOTE: Each correct selection is worth one point.
Hot Area: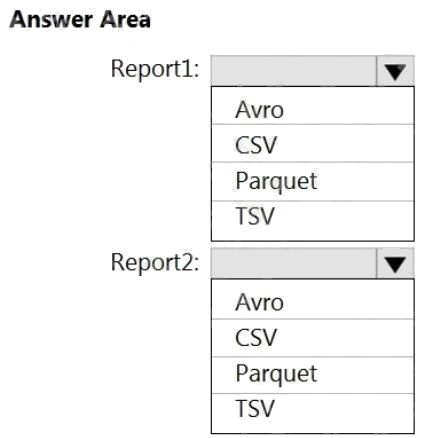
Answer:
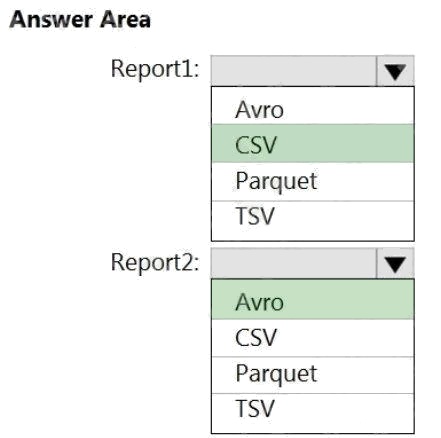
Explanation:
Report1: CSV
CSV: The destination writes records as delimited data.
Report2: AVRO
AVRO supports timestamps.
Not Parquet, TSV: Not options for Azure Data Lake Storage Gen2.
Reference: https://streamsets.com/documentation/datacollector/latest/help/datacollector/UserGuide/Destinations/ADLS-G2-
D.html
Comments
Question 5 Topic 3, Mixed Questions
You are designing the folder structure for an Azure Data Lake Storage Gen2 container.
Users will query data by using a variety of services including Azure Databricks and Azure Synapse Analytics serverless SQL
pools. The data will be secured by subject area. Most queries will include data from the current year or current month.
Which folder structure should you recommend to support fast queries and simplified folder security?
- A. /{SubjectArea}/{DataSource}/{DD}/{MM}/{YYYY}/{FileData}_{YYYY}_{MM}_{DD}.csv
- B. /{DD}/{MM}/{YYYY}/{SubjectArea}/{DataSource}/{FileData}_{YYYY}_{MM}_{DD}.csv
- C. /{YYYY}/{MM}/{DD}/{SubjectArea}/{DataSource}/{FileData}_{YYYY}_{MM}_{DD}.csv
- D. /{SubjectArea}/{DataSource}/{YYYY}/{MM}/{DD}/{FileData}_{YYYY}_{MM}_{DD}.csv
Answer:
D
Explanation:
There's an important reason to put the date at the end of the directory structure. If you want to lock down certain regions or
subject matters to users/groups, then you can easily do so with the POSIX permissions. Otherwise, if there was a need to
restrict a certain security group to viewing just the UK data or certain planes, with the date structure in front a separate
permission would be required for numerous directories under every hour directory. Additionally, having the date structure in
front would exponentially increase the number of directories as time went on.
Note: In IoT workloads, there can be a great deal of data being landed in the data store that spans across numerous
products, devices, organizations, and customers. Its important to pre-plan the directory layout for organization, security, and
efficient processing of the data for down-stream consumers. A general template to consider might be the following layout:
{Region}/{SubjectMatter(s)}/{yyyy}/{mm}/{dd}/{hh}/
Comments
Question 6 Topic 3, Mixed Questions
HOTSPOT
You need to output files from Azure Data Factory.
Which file format should you use for each type of output? To answer, select the appropriate options in the answer area.
NOTE: Each correct selection is worth one point.
Hot Area: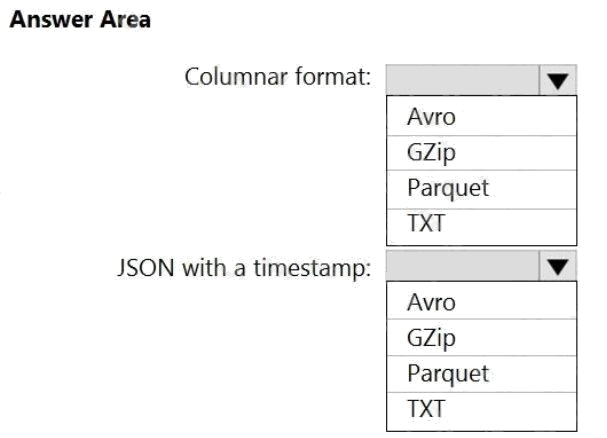
Answer:
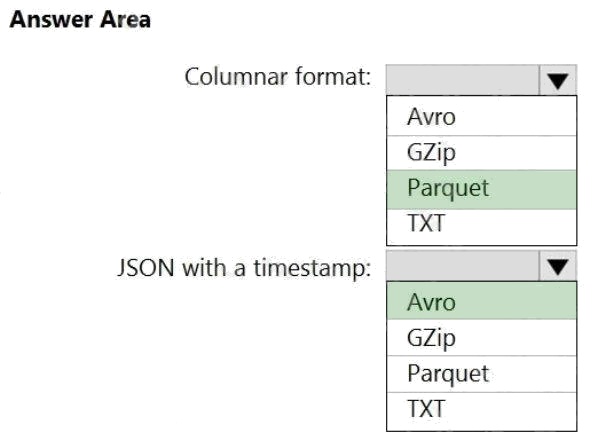
Explanation:
Box 1: Parquet
Parquet stores data in columns, while Avro stores data in a row-based format. By their very nature, column-oriented data
stores are optimized for read-heavy analytical workloads, while rowbased databases are best for write-heavy transactional
workloads.
Box 2: Avro
An Avro schema is created using JSON format. AVRO supports timestamps.
Note: Azure Data Factory supports the following file formats (not GZip or TXT).
Avro format
Binary format
Delimited text format
Excel format
JSON format ORC format

Parquet format XML format

Reference:
https://www.datanami.com/2018/05/16/big-data-file-formats-demystified
Comments
Question 7 Topic 3, Mixed Questions
HOTSPOT
You use Azure Data Factory to prepare data to be queried by Azure Synapse Analytics serverless SQL pools.
Files are initially ingested into an Azure Data Lake Storage Gen2 account as 10 small JSON files. Each file contains the
same data attributes and data from a subsidiary of your company.
You need to move the files to a different folder and transform the data to meet the following requirements:
Provide the fastest possible query times.
Automatically infer the schema from the underlying files.
How should you configure the Data Factory copy activity? To answer, select the appropriate options in the answer area.
NOTE: Each correct selection is worth one point.
Hot Area: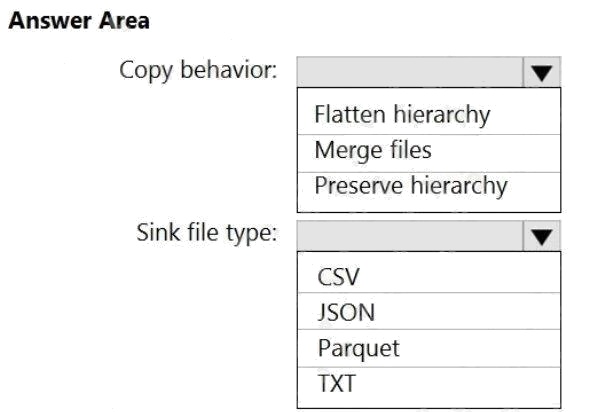
Answer:
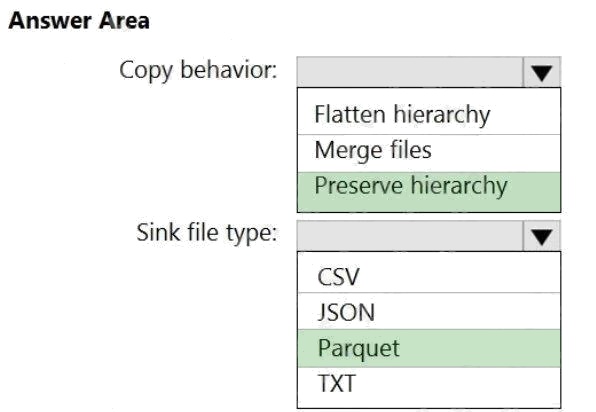
Explanation:
Box 1: Preserver herarchy
Compared to the flat namespace on Blob storage, the hierarchical namespace greatly improves the performance of directory
management operations, which improves overall job performance.
Box 2: Parquet
Azure Data Factory parquet format is supported for Azure Data Lake Storage Gen2. Parquet supports the schema property.
Reference: https://docs.microsoft.com/en-us/azure/storage/blobs/data-lake-storage-introduction
https://docs.microsoft.com/en-us/azure/data-factory/format-parquet
Comments
Question 8 Topic 3, Mixed Questions
HOTSPOT
You have a data model that you plan to implement in a data warehouse in Azure Synapse Analytics as shown in the
following exhibit.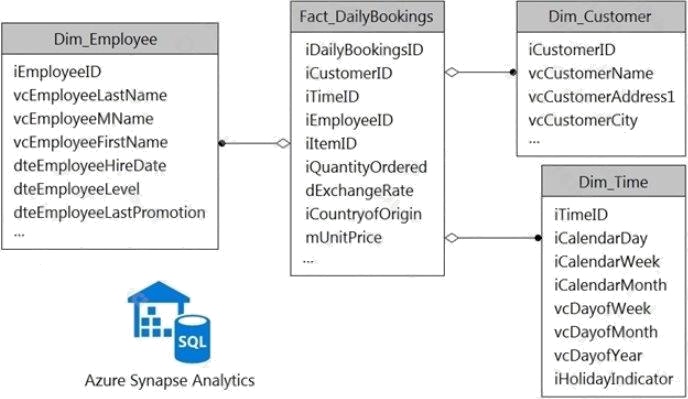
All the dimension tables will be less than 2 GB after compression, and the fact table will be approximately 6 TB.
Which type of table should you use for each table? To answer, select the appropriate options in the answer area.
NOTE: Each correct selection is worth one point.
Hot Area: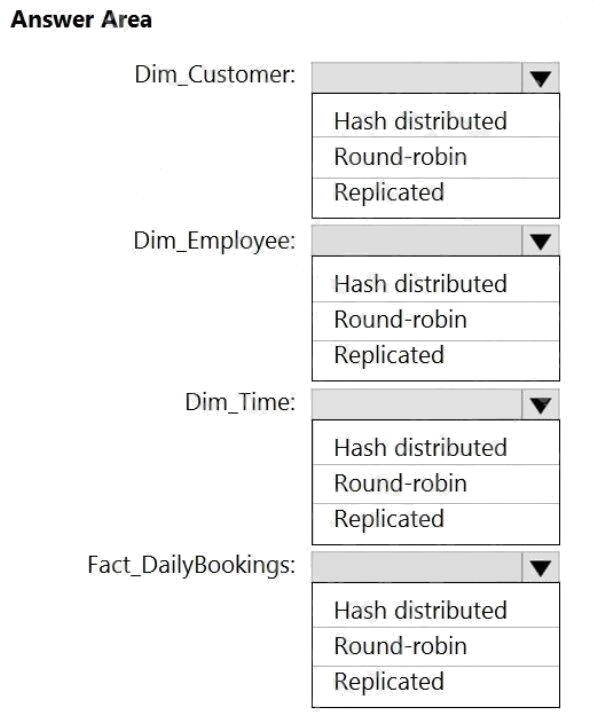
Answer:
Explanation:
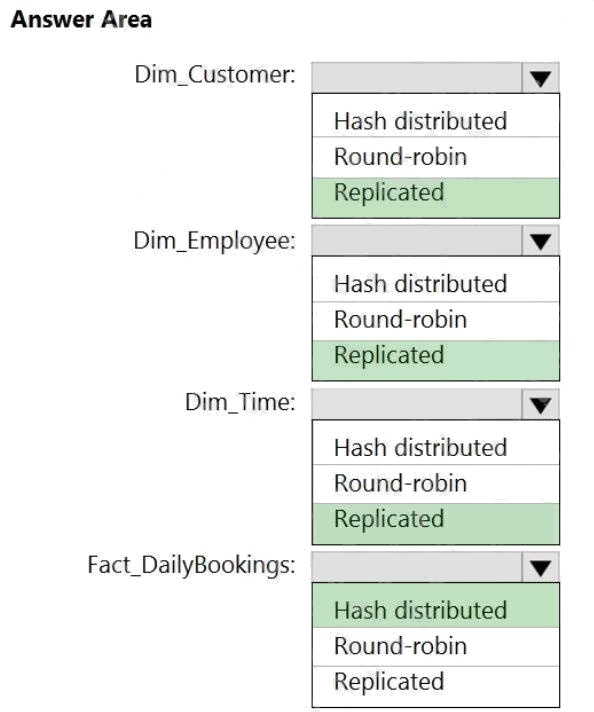
Box 1: Replicated
Replicated tables are ideal for small star-schema dimension tables, because the fact table is often distributed on a column
that is not compatible with the connected dimension tables. If this case applies to your schema, consider changing small
dimension tables currently implemented as round-robin to replicated.
Box 2: Replicated
Box 3: Replicated
Box 4: Hash-distributed
For Fact tables use hash-distribution with clustered columnstore index. Performance improves when two hash tables are
joined on the same distribution column.
Reference:
https://azure.microsoft.com/en-us/updates/reduce-data-movement-and-make-your-queries-more-efficient-with-the-general-
availability-of-replicated-tables/ https://azure.microsoft.com/en-us/blog/replicated-tables-now-generally-available-in-azure-
sql-data-warehouse/
Comments
Question 9 Topic 3, Mixed Questions
HOTSPOT
You have an Azure Data Lake Storage Gen2 container.
Data is ingested into the container, and then transformed by a data integration application. The data is NOT modified after
that. Users can read files in the container but cannot modify the files.
You need to design a data archiving solution that meets the following requirements:
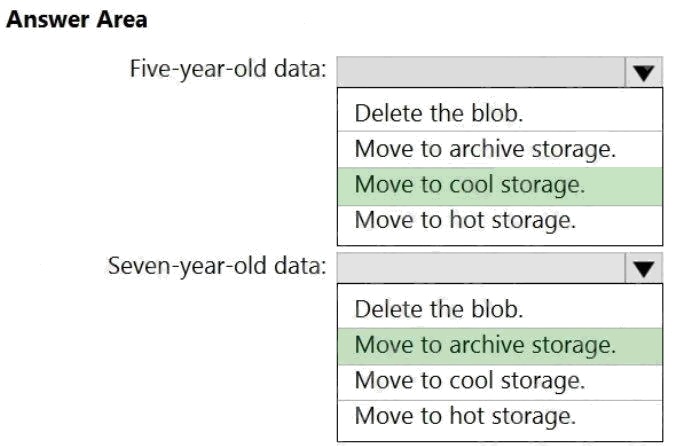
New data is accessed frequently and must be available as quickly as possible.
Data that is older than five years is accessed infrequently but must be available within one second when requested.
Data that is older than seven years is NOT accessed. After seven years, the data must be persisted at the lowest cost
possible. Costs must be minimized while maintaining the required availability.
How should you manage the data? To answer, select the appropriate options in the answer area. NOTE: Each correct
selection is worth one point
Hot Area: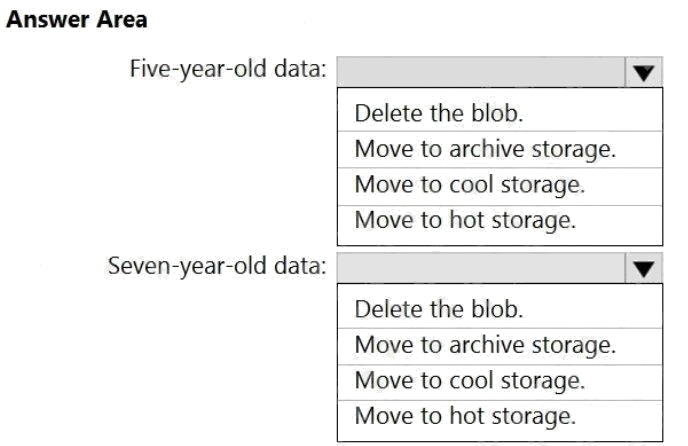
Answer:
Explanation:
Box 1: Move to cool storage
Box 2: Move to archive storage
Archive - Optimized for storing data that is rarely accessed and stored for at least 180 days with flexible latency
requirements, on the order of hours.
The following table shows a comparison of premium performance block blob storage, and the hot, cool, and archive access
tiers.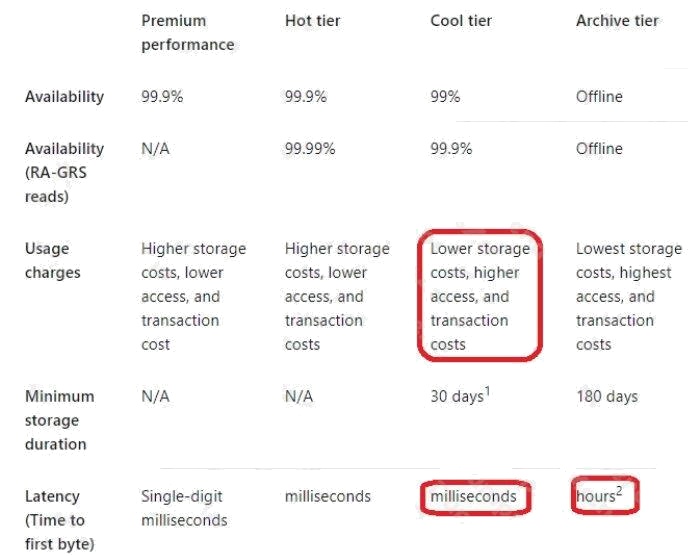
Reference:
https://docs.microsoft.com/en-us/azure/storage/blobs/storage-blob-storage-tiers
Comments
Question 10 Topic 3, Mixed Questions
DRAG DROP
You need to create a partitioned table in an Azure Synapse Analytics dedicated SQL pool.
How should you complete the Transact-SQL statement? To answer, drag the appropriate values to the correct targets. Each
value may be used once, more than once, or not at all. You may need to drag the split bar between panes or scroll to view
content.
NOTE: Each correct selection is worth one point.
Select and Place:
Answer:

Explanation:
Box 1: DISTRIBUTION
Table distribution options include DISTRIBUTION = HASH ( distribution_column_name ), assigns each row to one
distribution by hashing the value stored in distribution_column_name.
Box 2: PARTITION
Table partition options. Syntax:
PARTITION ( partition_column_name RANGE [ LEFT | RIGHT ] FOR VALUES ( [ boundary_value [,...n] ] ))
Reference:
https://docs.microsoft.com/en-us/sql/t-sql/statements/create-table-azure-sql-data-warehouse?
Comments
Page 1 out of 21
Viewing questions 1-10 out of 212
page 2